I don’t think a queue should be built up. Internally, it will pause until the current execute is done, and then wait for up to duration minutes to execute again.
I wonder if you can collect data before pumping (via execute_io_action) occurs. This way there should be no pumping that may interfere with OD readings.
Your note about checking if pumps are running: because multiple executes won’t run at the same time, I don’t see this as being a problem. Maybe I’m misunderstanding though.
Ok, I hadn’t realized that execute was blocking (or would only have 1 instance at any one time). There might not be any issue at all then. I did get the graph to finally show up and display data (yay!). I’m having a weird issue with it however that I can’t really figure out the cause of.
I have created the database successfully, but when it starts updating with new values, it’s giving me weird new data (but loads data from the SQL database fine). I suspect this might be something to do with mqtt?
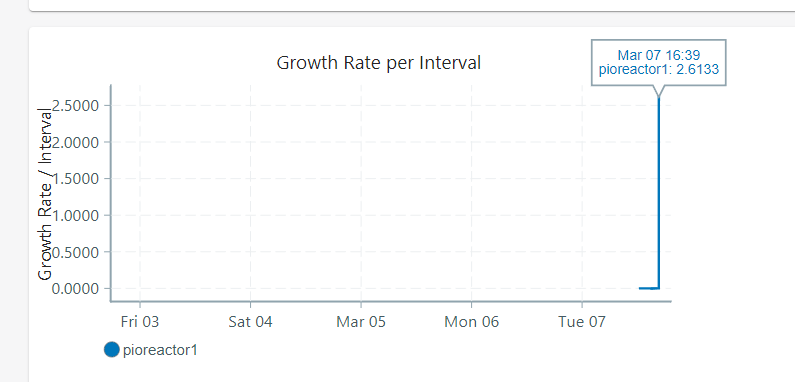
Also, I seem to be having difficulty getting charts stored in ~/.pioreactor/contr/charts/ to run. The chart below only started working once I moved the file from ~/.pioreactor/contrib/charts/ over to /var/www/pioreactorui/contrib/charts/.
Here’s my .yaml:
---
data_source: graph_gpi # SQL table
data_source_column: growth_per_interval
chart_key: growth_per_intervals
title: Growth Rate per Interval
mqtt_topic: gibberish
source: app
payload_key: od_filtered
y_axis_label: Growth Rate / Interval
interpolation: stepAfter
y_axis_domain: [-0.02, 0.1]
lookback: 1
fixed_decimals: 4
1 Like
Just leave the mqtt_topic blank in the yaml. Or just put in a gibberish string. We won’t have live data, but we can fix that easily later.
Also, I seem to be having difficulty getting charts stored in ~/.pioreactor/contr/charts/ to run.
Oops - there’s a typo in my code!
Path(env["DOT_PIOREACTOR"]) / "plugins" / "ui" "contrib" / "charts"
I’m missing a / between “ui” and “contrib” haha. I’ll fix for next release
Cool. It is still showing me all data since Friday and ignoring my lookback: 1 line. What is causing this? I updated the last .yaml I posted.
Live data: it’s quite easy. We just need to publish your calculated value to MQTT under a topic. Notes below:
from pioreactor.utils.timing import current_utc_timestamp
...


            if self.first_run is False:
                growth_per_interval = self.calculate_data()
                ### add this publish line below
                self.publish(
                    f"pioreactor/{self.unit}/{self.experiment}/{self.job_name}/growth_per_interval",
                    {"timestamp": current_utc_timestamp(), "growth_per_interval": growth_per_interval}
                )
                ###
                return events.DilutionEvent(
                    f"Latest Normalized OD = {latest_normalized_od_before_dosing:.2f} >= Target  nOD = {target_normalized_od_before_dosing:.2f}; cycled {results:2f} mL",
                    data = {
                        "growth_per_interval": growth_per_interval,
                        },
                    )
The first argument to publish is our topic:
f"pioreactor/{self.unit}/{self.experiment}/{self.job_name}/growth_per_interval",
will evaluate to something like: pioreactor/pioreactor1/my experiment/dosing_automation/growth_per_interval. Therefore in your yaml, for mqtt_topic, enter dosing_automation/growth_per_interval.
We are publishing a dictionary (we call this the payload) with keys timestamp and growth_per_interval. The yaml field payload_key should then be growth_per_interval. Internally, we extract the timestamp field too so we know where to plot the point on the x-axis.
1 Like
Re: lookback. Sorry, custom graphs ignore lookback parameter. This is missing, and I’ll add today or tomorrow.
Thanks, but how would the ui know that it is a custom graph? My graph is located in /var/www/pioreactorui/contrib/charts/09_turbidostat_growth_rate.yaml. I have another custom graph I made at /var/www/pioreactorui/contrib/charts/07_normalized_od_24_hours.yaml that is using the proper lookback value I give it. I am not sure why these two graphs would be treated differently.
It’s an endpoint in the webserver that is hit. There are endpoints for growth rate, temperature, etc. - but also a general fallback one that everything else goes through. This doesn’t have lookback code in it (yet). Example: compare the two functions here: pioreactorui/views.py at master · Pioreactor/pioreactorui · GitHub - the first is for od_readings, and the second is for everything else (i.e. custom charts).
07_normalized_od_24_hours works because it’s hitting a specific endpoint: pioreactorui/views.py at master · Pioreactor/pioreactorui · GitHub
That’s quite clever of you to create a custom chart with a specific lookback - I never thought of that!
Interesting to know.
I’m trying to delete some of the older data so it doesn’t show up in my new chart anymore, but I’m having some initial difficulty with figuring out the proper SQLite commands.
I want to do something like: DELETE FROM graph_gpi WHERE timestamp < DATETIME('now', '-1 hour'), but I don’t think I can because this is a view and not a table. I think a better method would be to try and update the view to incorporate the new WHERE timestamp < DATETIME... condition, but I don’t know how to modify/look at the settings for an existing view.