Hi there, I recently completed a batch growth experiment that had some bizarre behavior of the optical system in multiple Pioreactors that I’d like some help understanding.
My experiment had varied media composition across conditions (36, 3.6, and 0.36 g/L sucrose with all other nutrients with constant concentration). I calibrated the optical systems of my Pioreactors with a relatively dense culture grown in medium with 36 g/L sucrose (as I didn’t have dense cultures of the other conditions at that point).
I used the “older” OD calibration method via serial dilutions (not the newer one with set standards) and used the same vial of culture for all 9 of my workers so that they had consistent measurements across individual sets of photodiodes. To do this, between each step I moved the vial with culture to another worker (after the measurement was complete and I was prompted to add more media), took that measurement, and repeated for all my workers (and then looped back to the first one). I started at a measured OD600 on a plate reader of 1.73 and ended with my media blank at 0.041. I diluted in 3 mL additions (18 total steps per worker) and took measurements on a plate reader for cross reference at each opportunity.
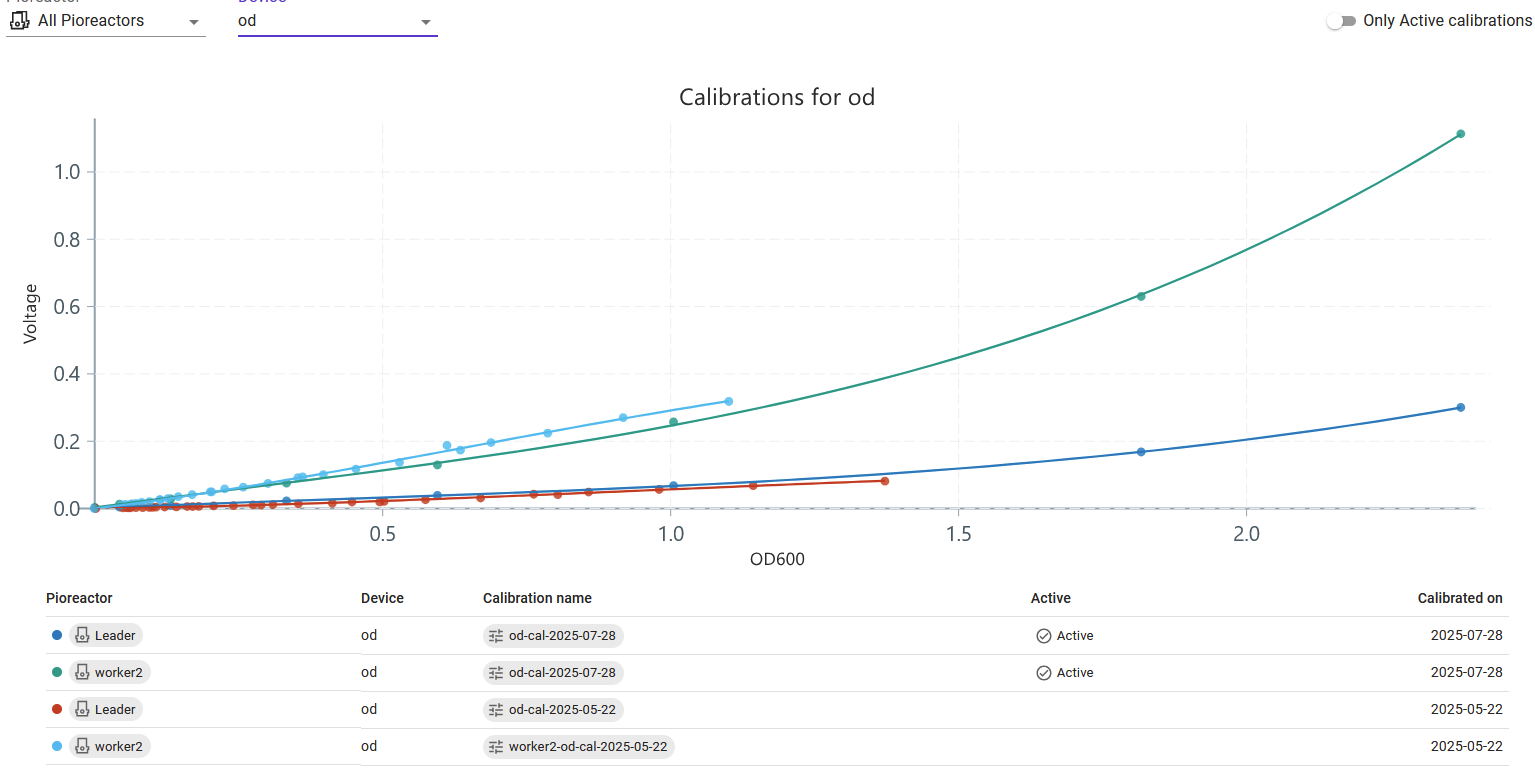
The spread between the voltage range of individual workers’ seemed relatively wide to me, so I don’t know why that was the case. I also would’ve thought over such a range the calibration would fit a 4th order polynomial, but it reported 1st order for all of my calibrations (and seemed to ignore my densest point in all cases, maybe because of how much of a change there was in the reading from the first dilution). See graph below:

When I went to prep for my experiment by taking a blank measurement with each Pioreactor, when I clicked the button in the UI on the first worker, the wheel icon spun for a while with the button greyed out and then it stayed that way with no further progress. There was nothing in the logs that showed that this action had occurred or that it was making progress and all of my other workers had the blank button similarly greyed out as if the operation was still occurring.
I was under a slight time crunch, so I moved forward with starting the automations for my experiment with my inoculated cultures. For each condition, I prepared one inoculum with extra volume for each condition (30 mL) and then dispensed 10 mL of media + cells to 2 vials per condition (along with a no cell of plain media). Despite my earlier calibration using very similar media that should not have changed the OD reading significantly (based on measurements performed on multiple different plate readers), when I started my automations, I got a warning in all of my cultures that the signal was outside the calibration range. Signal outside suggested calibration range. Trimming signal. Calibrated for OD=[0.041, 1.73], V=[0.00189, 0.366]. Observed 0.041V.
The reported value was lower than what blank media at the end of the calibration had reported as, despite being in some cases identical or quite similar (sucrose concentration in this range appeared to have a very minor impact on scattering in my experience). Additionally, all the inoculated cultures read notably lower than what was recorded on the plate reader - obviously there would be some variation, but this was beyond what I would expect, especially after having been calibrated.
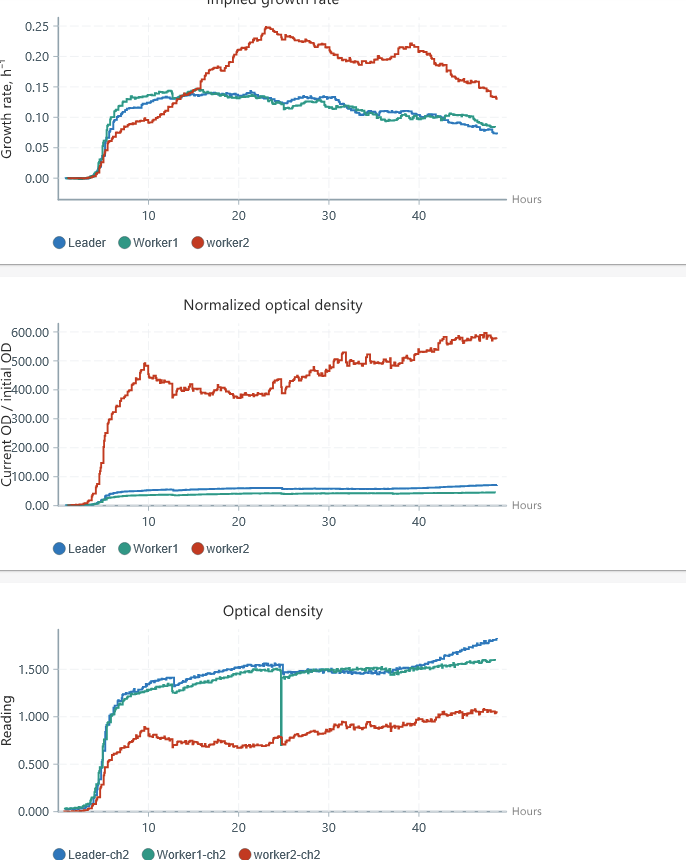
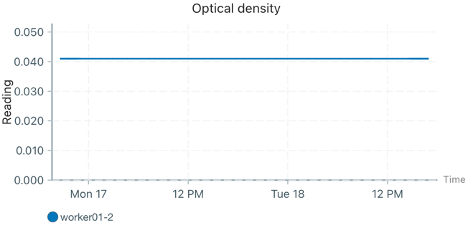
When I checked the plots the next day, there was bizarre behavior in two of the workers (I’m only showing one here representatively). Despite being inoculated with cells, the initial density held perfectly constant for about 4 hours (likely due to being below the calibration threshold, which was somewhat expected given the warnings). Following this, the reported OD dropped, and then slowly climbed over the length of the experiment (but nowhere near the actual expected growth based on the replicate that did not have this issue). See graphs below of the no cell, impacted worker, and unaffected worker respectively.
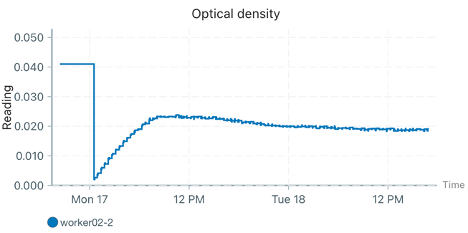
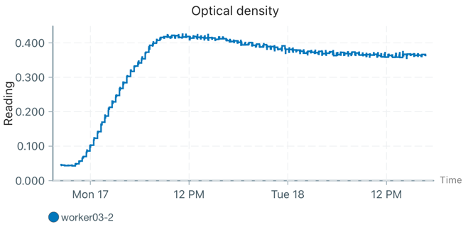
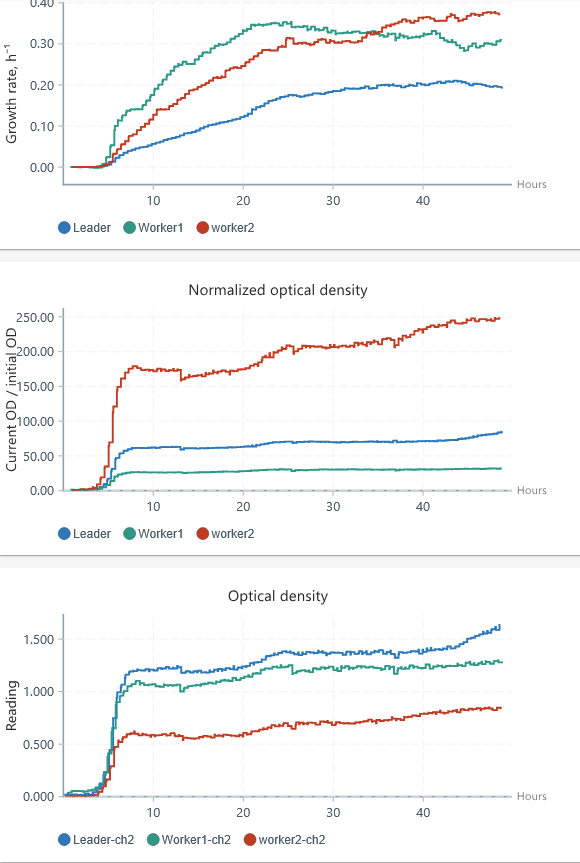
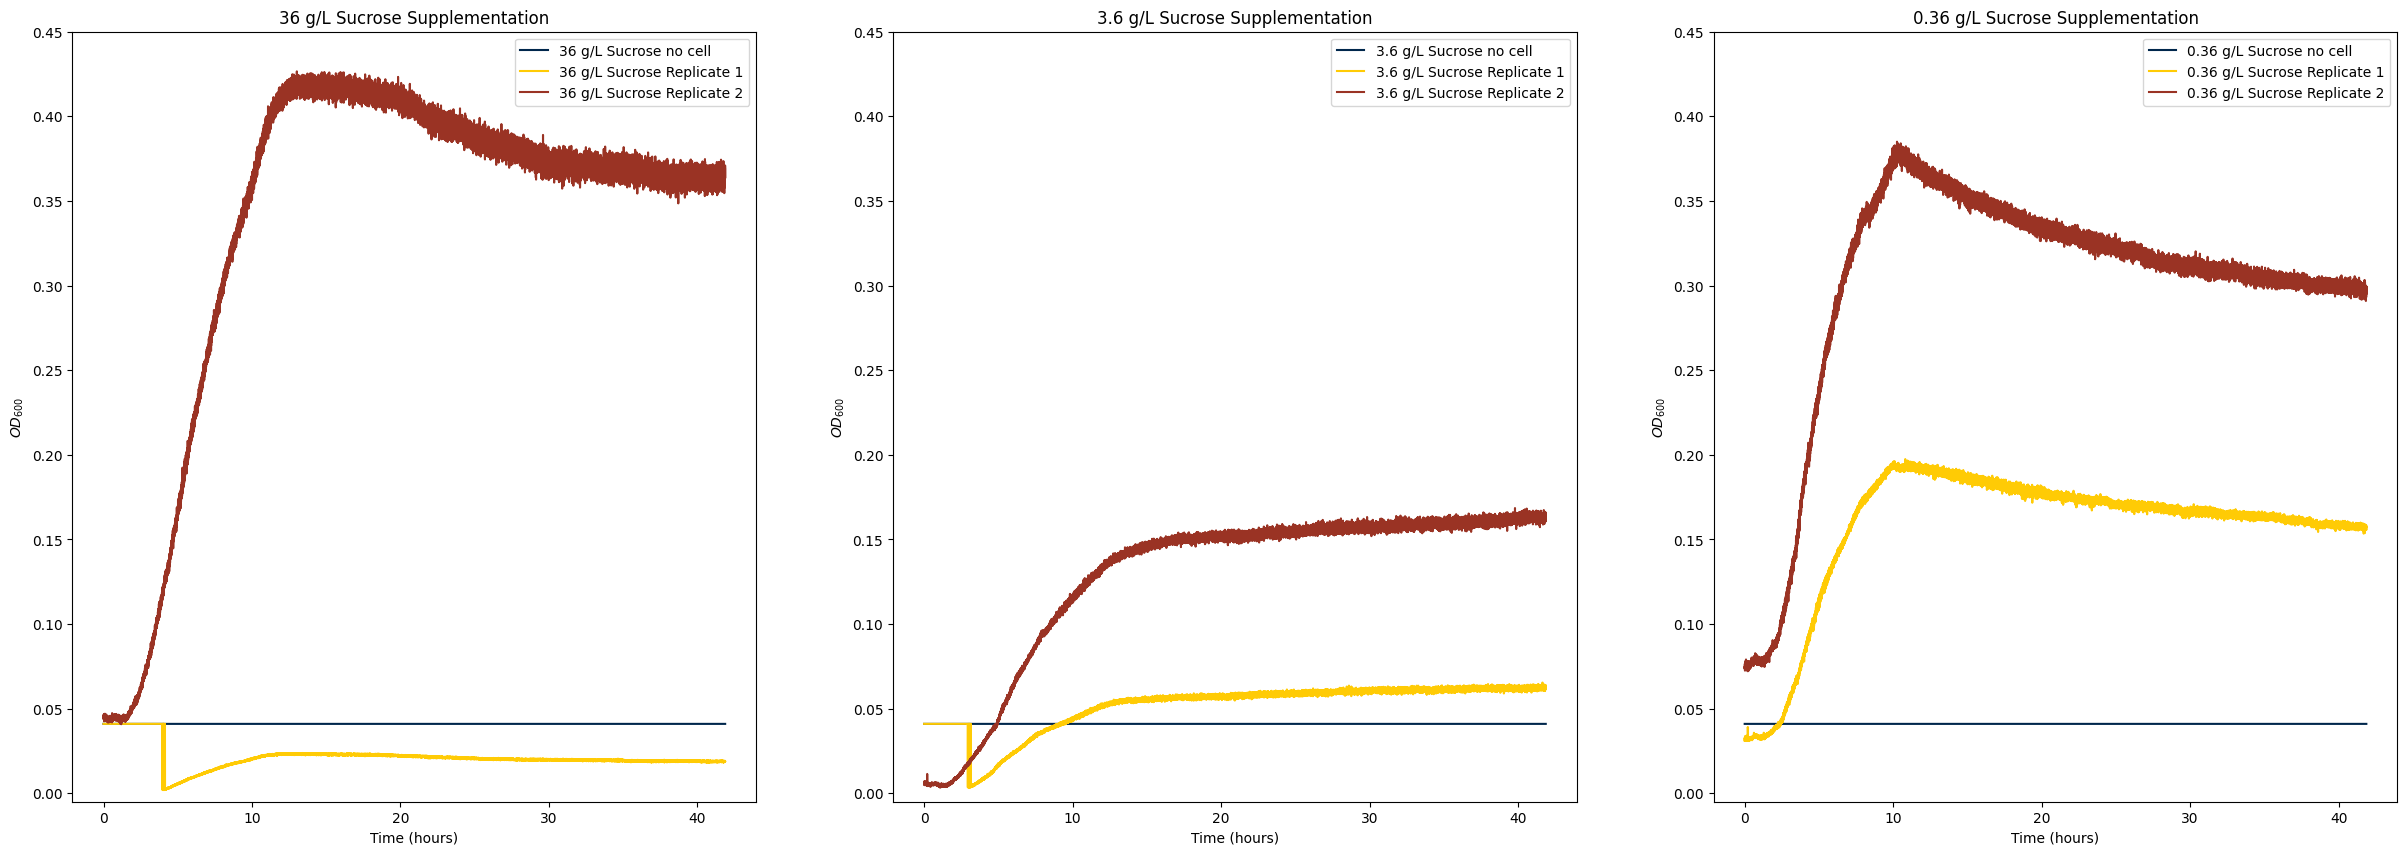
This happened with a worker in two of my conditions and in the third condition while this didn’t happen, the growth curve of one of the replicates was significantly depressed compared to each other. Keep in mind in all of these cases, the inoculum between the two replicates for each condition was identical. I’ve attached a graph I plotted of each worker for each condition grouped for easier visibility that shows this phenomenon:
When I ended the experiment, I checked the final cell density of each culture on two different plate readers, and while there was some variation between replicates, they were relatively close to each other in final density (except for the last case where there was reduced growth in one replicate, so that likely was a biological issue rather than a hardware/software issue).
I recognize something clearly was not ideal about my calibration that led to some of these issues, but I’m having trouble wrapping my head around what would’ve caused the weird phenomenon multiple hours into the experiment in two of my workers. From checking the logs (which is more difficult given how frequent the signal warning was posted), I don’t see anything different that caused the signal drop and it to start performing properly. I know this is a very long post, but I wanted to provide as much context as I could to try to figure out what caused this error, I’ve never encountered anything like it before. Thank you!