I am trying to access the user interface (UI) through pioreactor.local. However I cannot connect to the server if I do not connect through using the <leader_name>.local.
This occured after I accidentally added two leaders into my cluster by using the method in my last topic Export Data: Workers.
After the incident, I:
Flashed and created a new leader SD Card (local access)
Converted one of the leaders to worker (so there is only one leader in the local access cluster)
Removed the old network credentials from all works
Updated all the pioreactors to 24.3.10
Rebooted all the workers and confirmed that domain_alias=pioreactor.local
Additional information, I can also access to the UI through IP address, and my colleague who has her own cluster close to my clusters cannot access to her cluster through using pioreactor.local either. Hence, perhaps this is a late update bug?
Let me know if anyone encountered a similar issue or have an idea of the potential cause?
The problem has to do with some new logic added to pio (you can’t run pio as root anymore), and permissions. Try copy-pasting the following file to your leader’s Pi: update.sh · GitHub
And run it with:
sudo bash update.sh
You should only need to run ^ once. I think that’ll solve the problem.
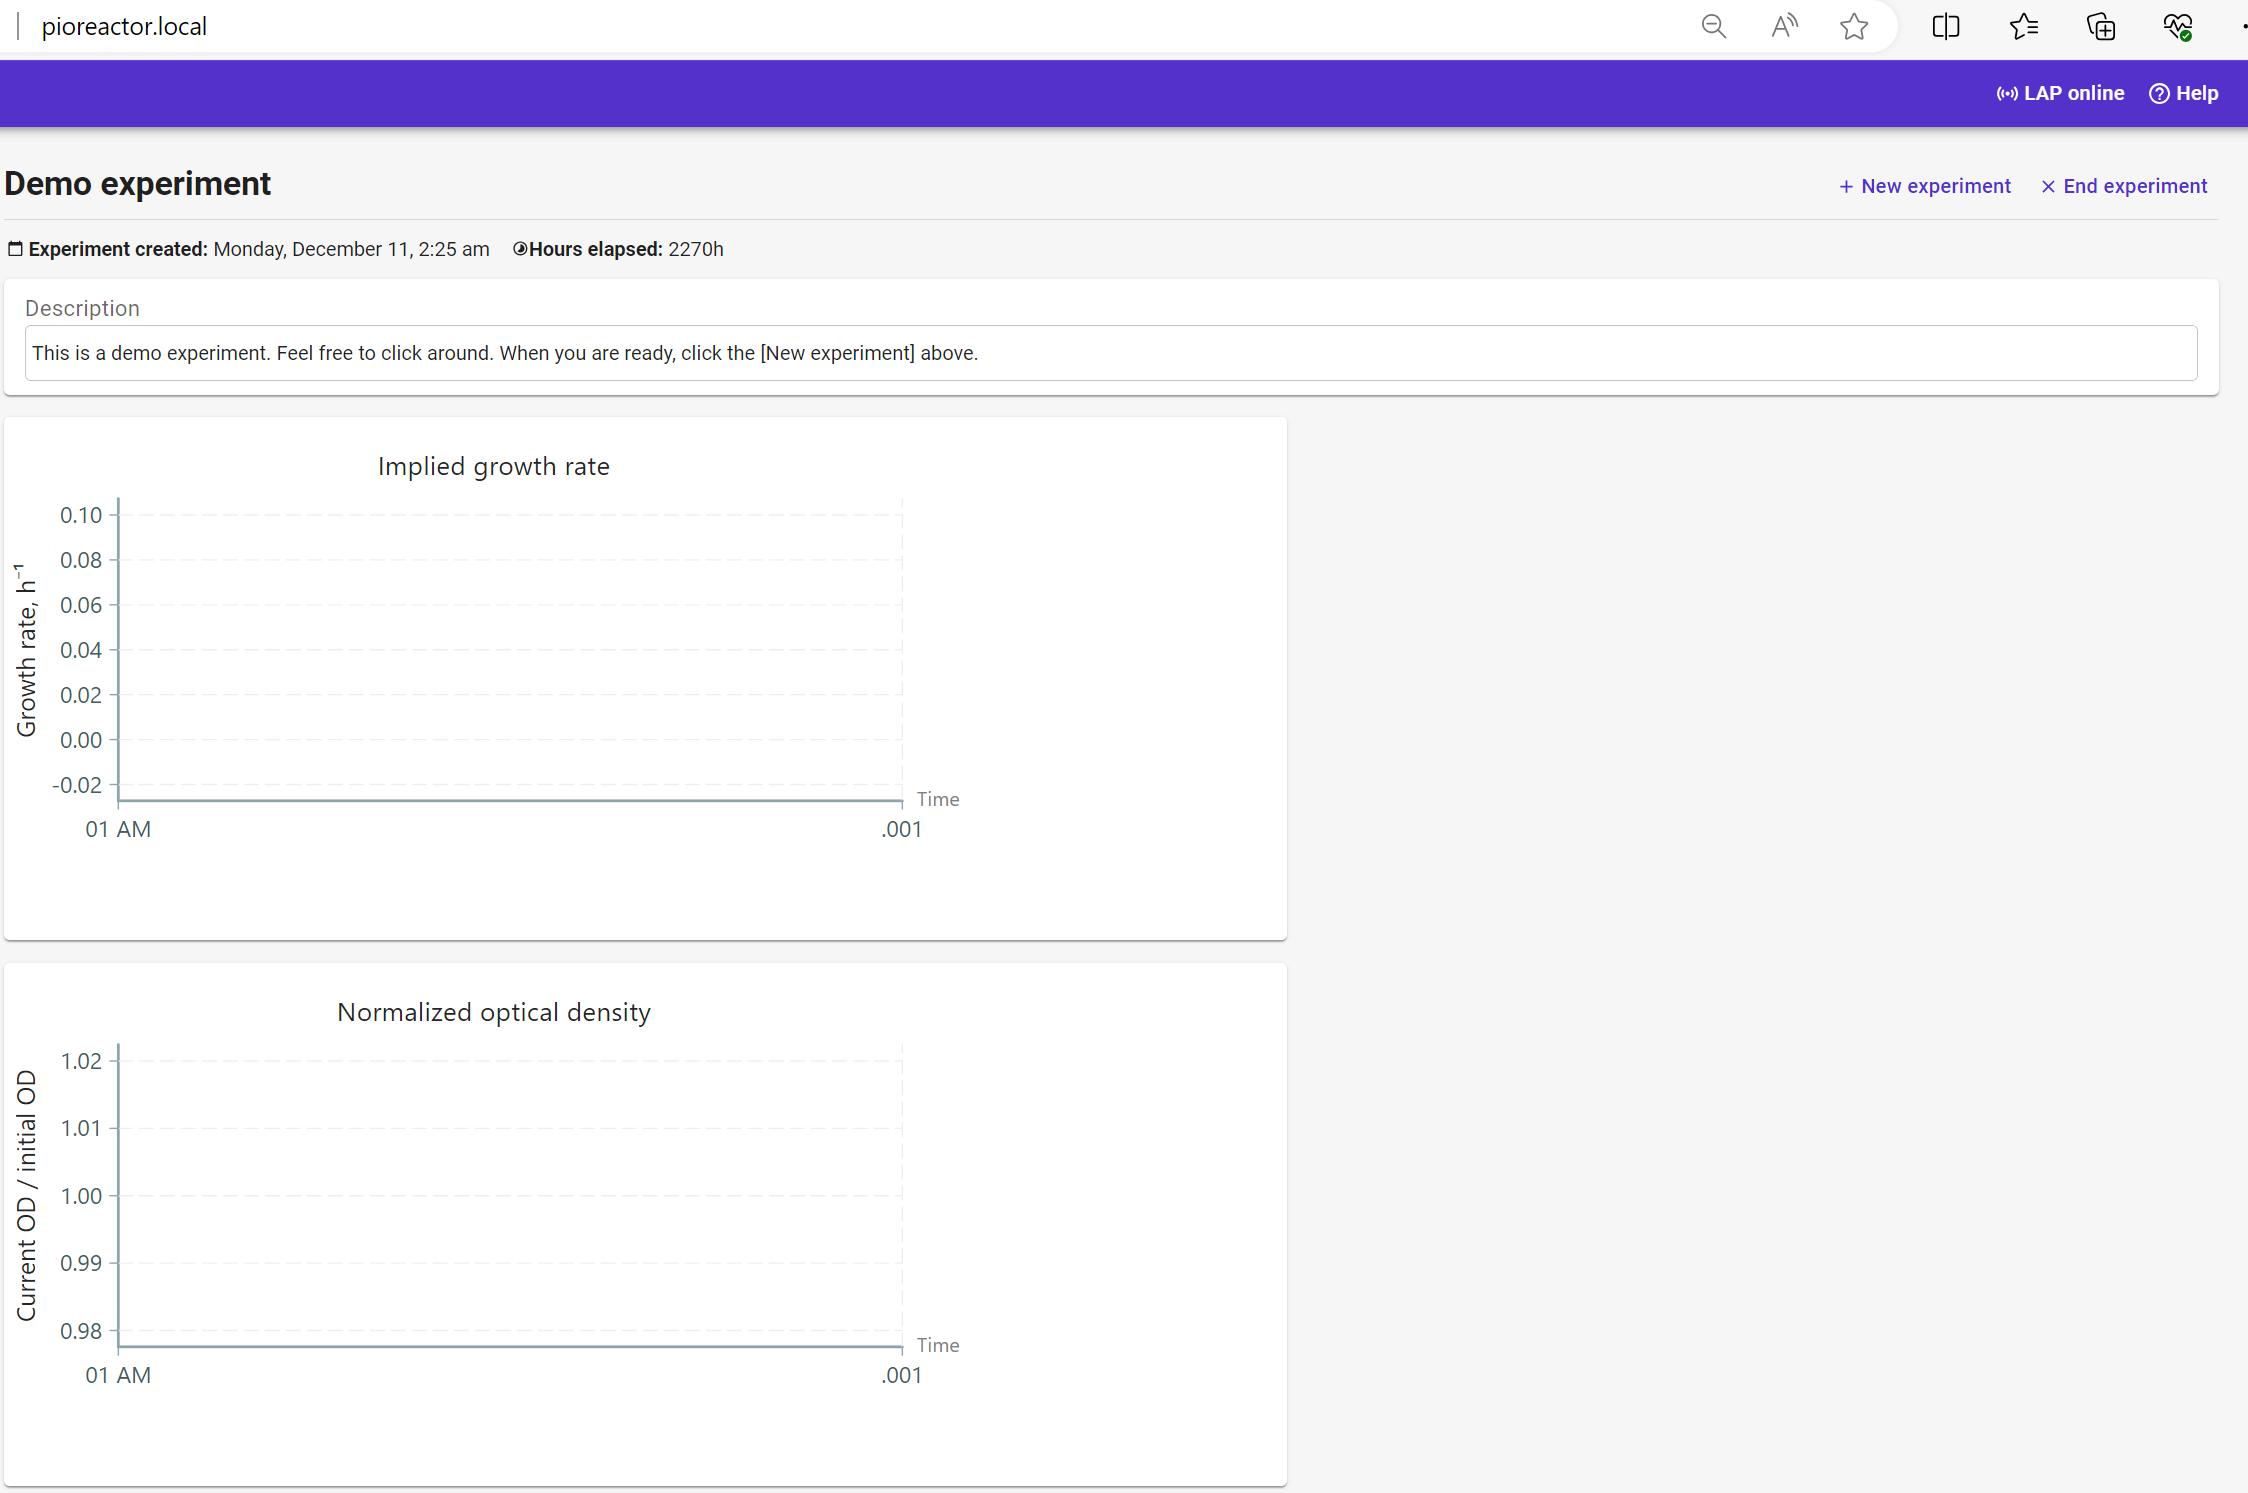
Now, i can access using pioreactor.local. However, the overview window does not appear fully, even after refreshing the page. I checked and it does appear fully when accessed through <leader_name>.local.
haha okay, that’s weird. Sounds like a browser issue with Edge (I’ve not tested on Edge before). I’ll investigate now, but yea, sounds unrelated to http://pioreactor.local access.
Hey Cameron, Thanks for this! Just to let you know, after coming back to work this monday I was not able to access the pioreactor interface using pioreactor.local nor via the IP address. This fixed the issue
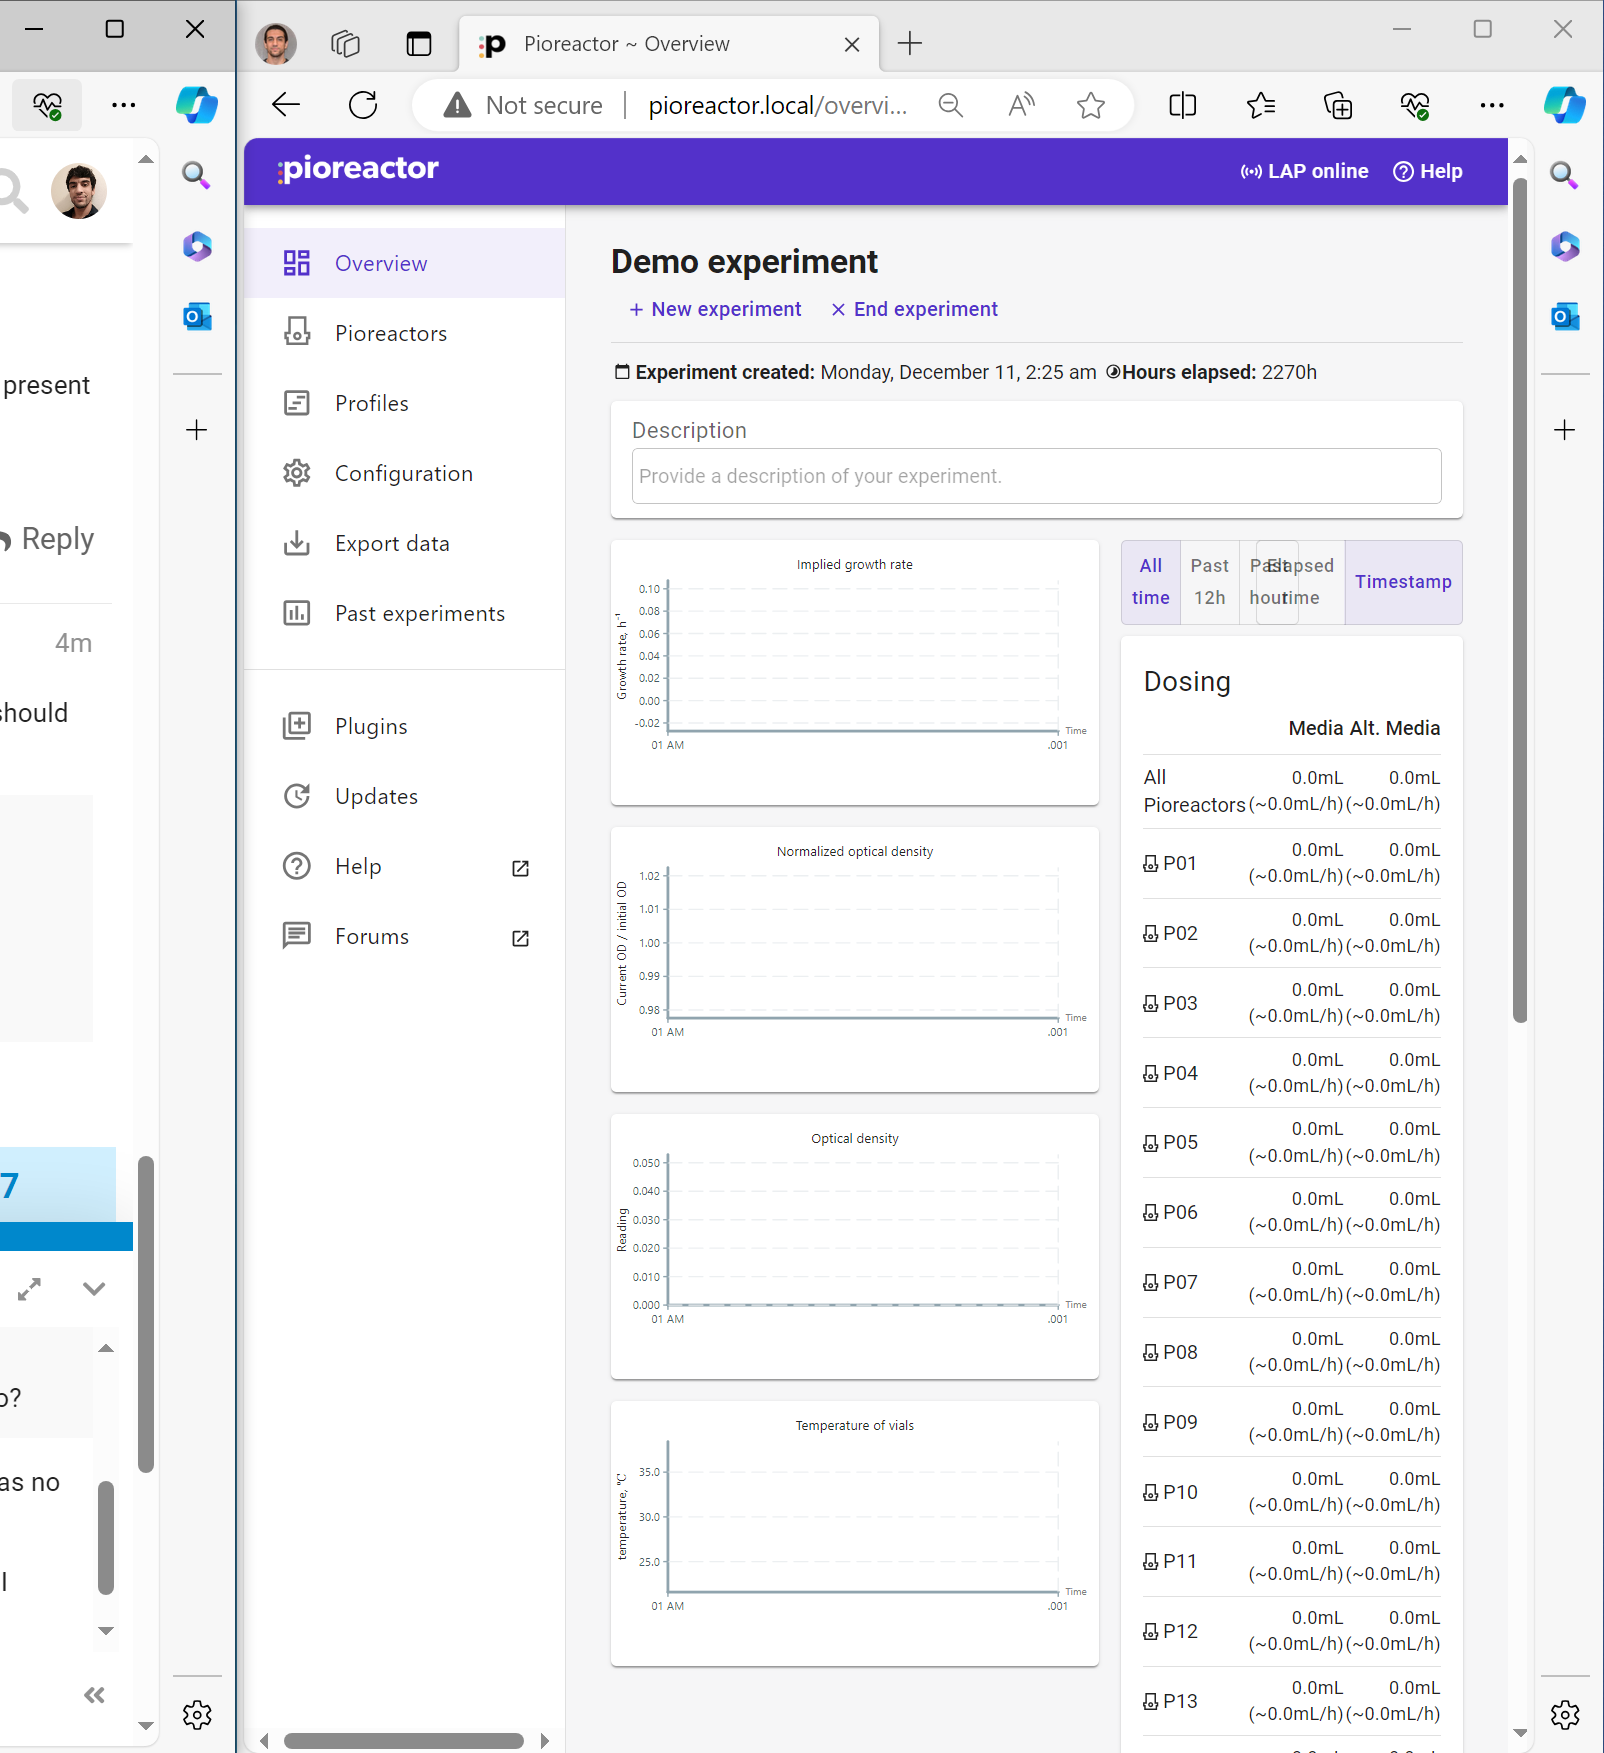
Just an update on this specific UI issue (log table missing - it’s actually hidden below the charts): I’ve noticed this occurs when a browser’s magnification is at 90%.