DIY Graph y_transformation

Hello! I have a calibration for Pioreactor per unit OD readings vs. cell counts generated from a cell counting device and am trying to add it to the Pioreactor interface graph page. So far I’ve followed along with how to generate a new graph tile and add it to the interface, but am having trouble with the “y_transformation” part of the .yaml format - I thought this would be the easiest way to implement this. I need, for each pioreactor unit, to plug in a simple y = mx + b formula (where x is the OD reading) to the y_transformation.

Has anyone done this, or could point me where to go? Included below is the .yaml file I currently have in the system, a slightly edited version of the od chart from the github.

---
chart_key: cell count transform
data_source: od_readings
title: Cell Counts
mqtt_topic: [od_reading/od1, od_reading/od2]
source: app
payload_key: od
y_axis_label: Cell Count per mL, e+07
interpolation: stepAfter
lookback: parseFloat(config['ui.overview.settings']['raw_od_lookback_hours'])
fixed_decimals: 3
y_axis_domain: [0.001, 0.05]
y_transformation: ##Placeholder
down_sample: true

Thank you!
-Trevor

Hi Trevor,

I see what you are trying to do, and it’s very cool! However, what you want can’t be done with the y_transformation tool. It really only expects a simple function float -> float (ex: no data on which unit is inputted).

There’s an alternative solution is to use the calibration system to create calibration files for each Pioreactor.

Let me know if you want some help with this. Here are docs on calibrations, but you don’t need to implement all of this.

Thanks for the response!

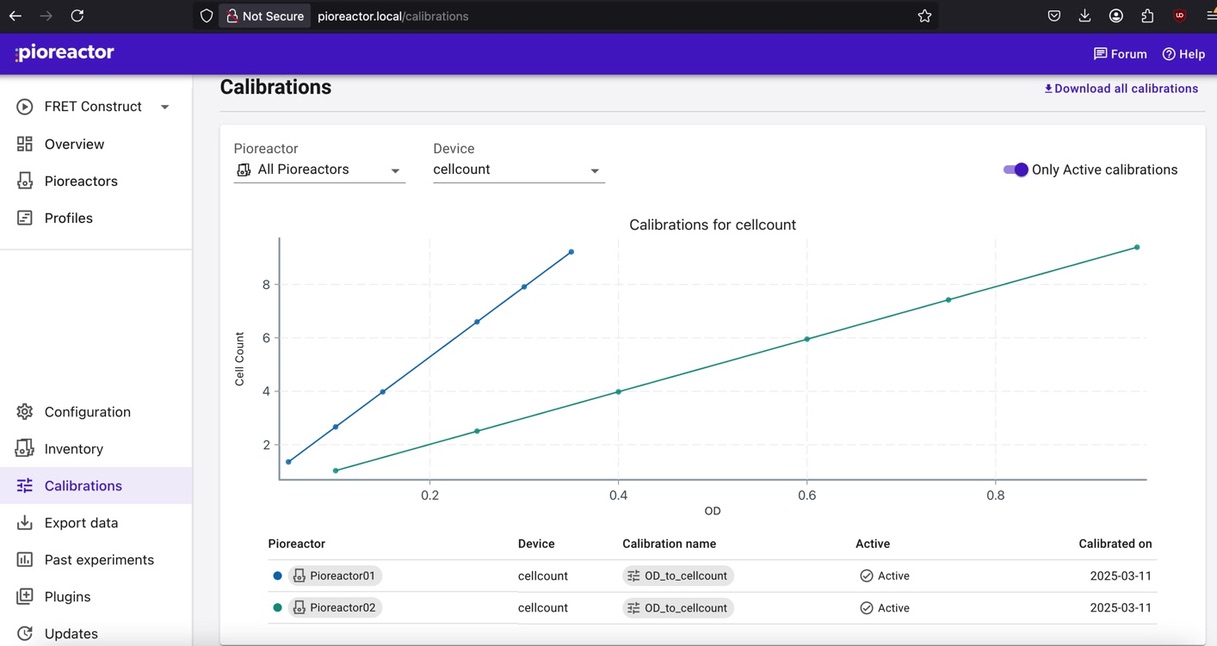
I have (pictured w/ some Frankenstein code below) some calibration curves in the calibration section of the UI - is there an easy way to get this to apply to the OD readings and populate in the graph section of the UI?

from __future__ import annotations

import time
from typing import Callable
from typing import Literal

import click
from click import Abort
from click import clear
from click import confirm
from click import echo
from click import prompt
from click import style

from pioreactor.calibrations import CalibrationProtocol
from pioreactor.structs import CalibrationBase
from pioreactor import whoami
import typing as t


from pioreactor import structs
from pioreactor.calibrations import list_of_calibrations_by_device
from pioreactor.calibrations.utils import curve_to_callable
from pioreactor.calibrations import CalibrationProtocol
from pioreactor.config import config
from pioreactor.hardware import voltage_in_aux
from pioreactor.logging import create_logger
from pioreactor.utils import managed_lifecycle
from pioreactor.utils.math_helpers import correlation
from pioreactor.utils.math_helpers import simple_linear_regression
from pioreactor.utils.timing import current_utc_datestamp
from pioreactor.utils.timing import current_utc_datetime
from pioreactor.whoami import get_assigned_experiment_name
from pioreactor.whoami import get_testing_experiment_name
from pioreactor.whoami import get_unit_name

class CellCountCalibration(CalibrationBase, kw_only=True, tag="cellcount"):
    x: str = "OD"       # required
    y: str = "Cell Count, e+07 cells/mL"  # required

    # not required, but helpful
    def cellcount_to_od(self, cellcount: float) -> float:
        return self.y_to_x(cellcount)

    def od_to_cellcount(self, od: float) -> float:
        return self.x_to_y(od)

class CellCountProtocol(CalibrationProtocol):
    target_device = "cellcount"
    protocol_name = "cellCount"
    description = "Correlate OD to Cell count"

    def run(self, target_device: str):
        return run_cellcount_calibration()

def run_cellcount_calibration():
   unit = get_unit_name()
   experiment = get_testing_experiment_name()
   action_name = "cellcount_equation"
    
   ODs = []
   Cellcounts = []
    
   numbertests = 6
   click.echo(f"Collecting {numbertests} OD and Cell Count pairs for calibration...\n")

   for i in range(numbertests):
        od = click.prompt(f"Enter OD reading for test {i + 1}", type=float)
        count = click.prompt(f"Enter cell count (e+07 cells/mL) for test {i + 1}", type=float)
        ODs.append(od)
        Cellcounts.append(count)

   (alpha, _), (beta, _) = simple_linear_regression(ODs, Cellcounts)

   return CellCountCalibration(
        calibration_name="OD_to_cellcount",
        calibrated_on_pioreactor_unit=whoami.get_unit_name(),
        created_at=current_utc_datetime(),
        curve_data_=[alpha, beta],
        curve_type="poly",
        x="OD",
        y="Cell Count",
        recorded_data={"x": list(ODs), "y": list(Cellcounts)},
    )