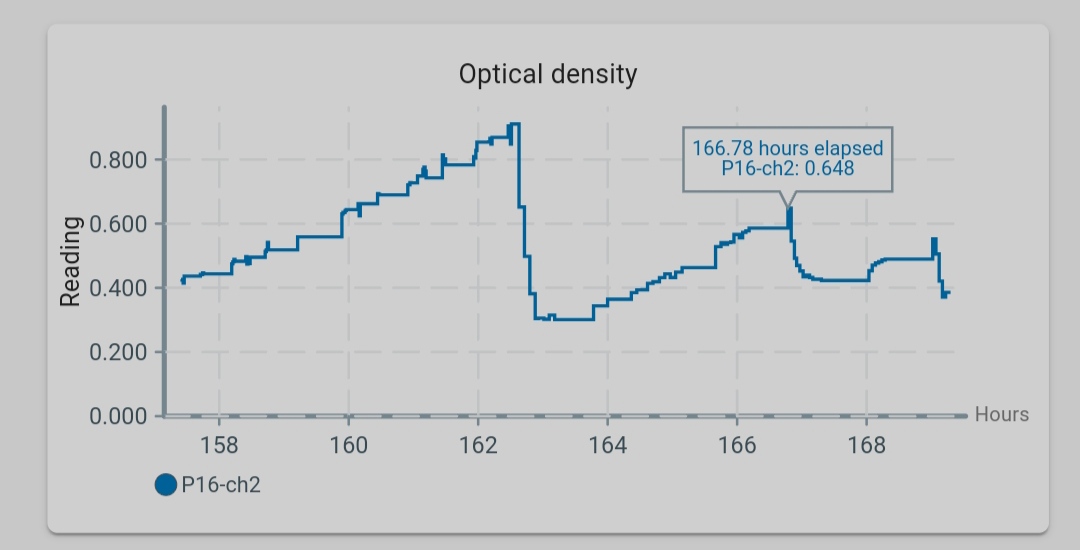
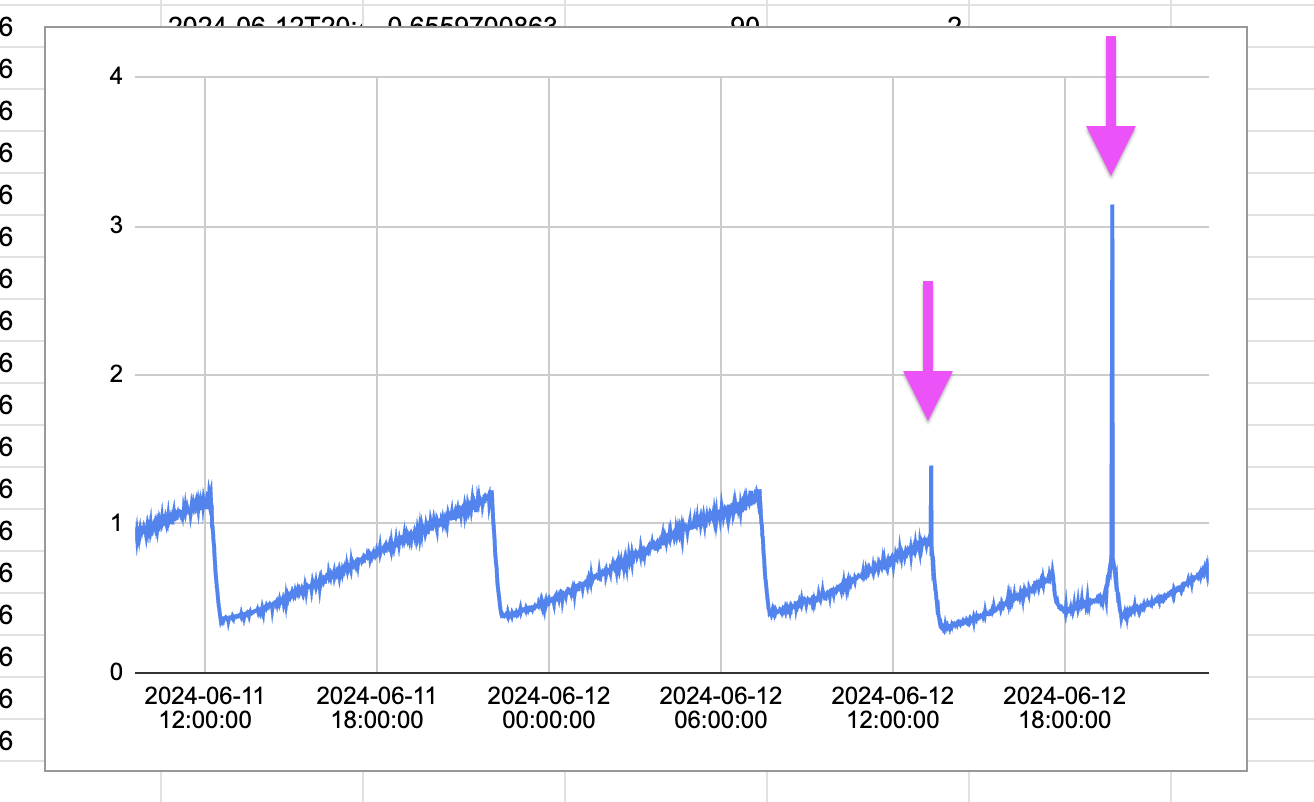
I am running turbidostat automation with a target OD 1.2 and dilution volume of 20 mL in 20 mL vials. At the beginning the dilutions were tsking place at the stated OD target, however, now it takes place at a lower OD values (first at 0.9, second at 0.6, and last dilution at 0.5 - illustrated in the picture below)
that’s strange! Your recent logs should say something like: Latest OD = x ≥ Target OD = 1.2; cycled 20 mL after the dilutions have occurred - do you see that in the logs? That should tell us what the algorithm is seeing, and why it’s triggering.
What is the chance that this happens due to having really high dilution volume?
I don’t suspect this, but it’s unique enough that I don’t want to rule it out.
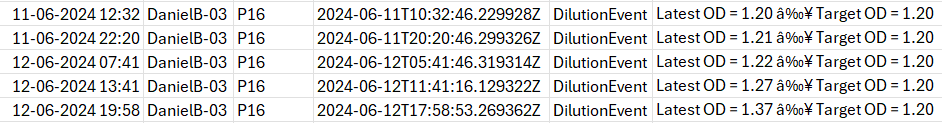
Okay, now it gets wierder, according to the dosing logs, I only have 3 dilution registeries on 12-06-2024, and the last dilution (the one in the picture below) occured at 19:58
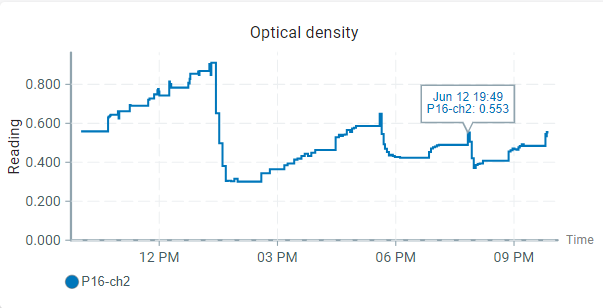
However, in the user interface plot it is stated at 19:49
In addition, I could not see any log registry for the dilution event I showed in the previous picture (which should have occured around 17:35 based on the user interface):
Part of it is a lag between logging the “event” and the act of dilution. To cycle 20ml, it may take a while (like on the order of minutes), and we log the DilutionEvent after the dilution completes. So that would explain why 19:49 != 19:58.
From the logs shown: the turbidostat is suggesting that the OD is surpassing 1.20. That is surprising, since nowhere on your graph is it touching 1.2.
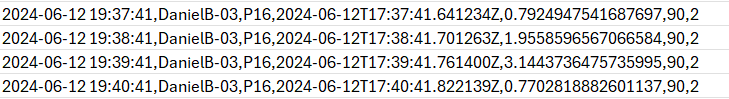
It looks like there has been a spike in the OD measurements which might have been the reason to start the dilution event in the last dilution log (19:49)
This still does not explain the reason for previous encounters though
There is a small moving average component to the turbidostats implemented to filter out spikes (though this spike may be too largee), but this could also cause some latency in when a dosing trigger occurs. (I haven’t received an email yet, if the file is too big I can share an alternate method)
Thanks for the update! The folder is not big actually but I think the issue was that it was not sent, so I just sent another email. Hopefully, this will work.
I think part of the problem is a chart limitation: we can’t show every data point from the last 12 hours (12 hours * 60 min / hour * 12 data samples per min¹ = 8640 points per unit) since it would probably crash the UI. So we down-sample the data points. This is probably missing the spikes that are causing dosing events.
I’m still looking into matching all the events, so there’s more to come.
¹You are sampling once a minute, and not once every 5 seconds, so the UI can probably support that. We can easily remove the down-sampling in this chart:
Okay, it looks like we have been really unlucky to get spikes in consecutive OD readings after another dilution event. I assume this was on us, as we were using high RPM (1100) for stirring.
Considering the default setup (OD reading per 5 seconds), it does makese sense to implement down-sampling. In addition, one can technically still access to the data points through the logs.
Thanks for the elaborate break down of the situation and quick steps provided to turn-off down sizing. Your time and help is deeply appreciated @CamDavidsonPilon!