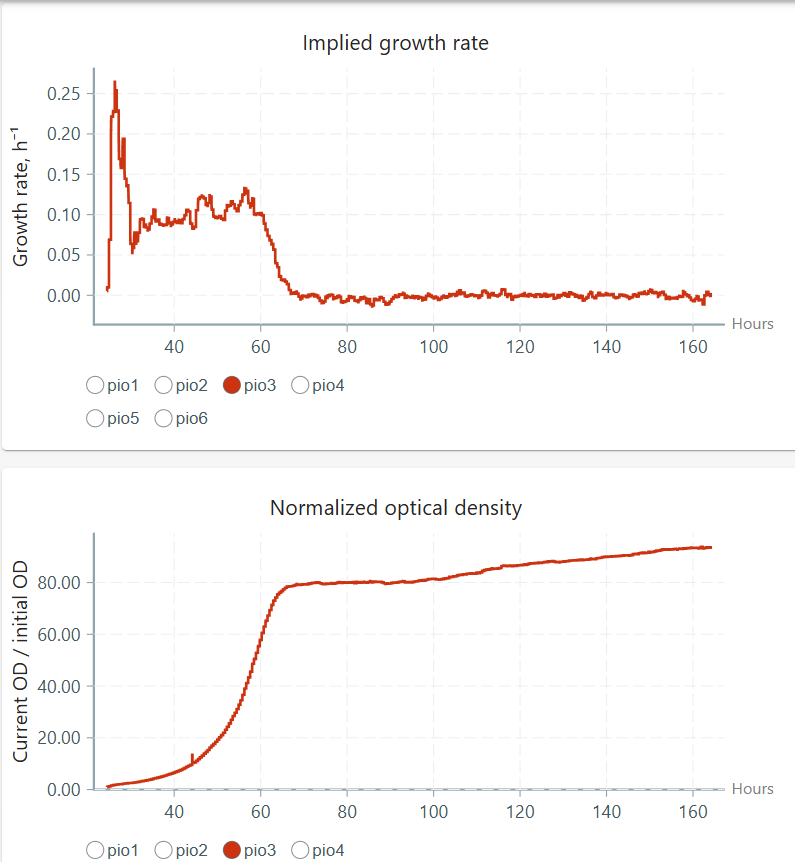
In this experiment I grew yeast in YPD + 1.5M NaCl.
For some reason, after 40 hours of a classic stationary phase, the culture OD began to rise with a linear slope. although the nOD grew in 10 units, it is not represented at all in the growth rate graph.
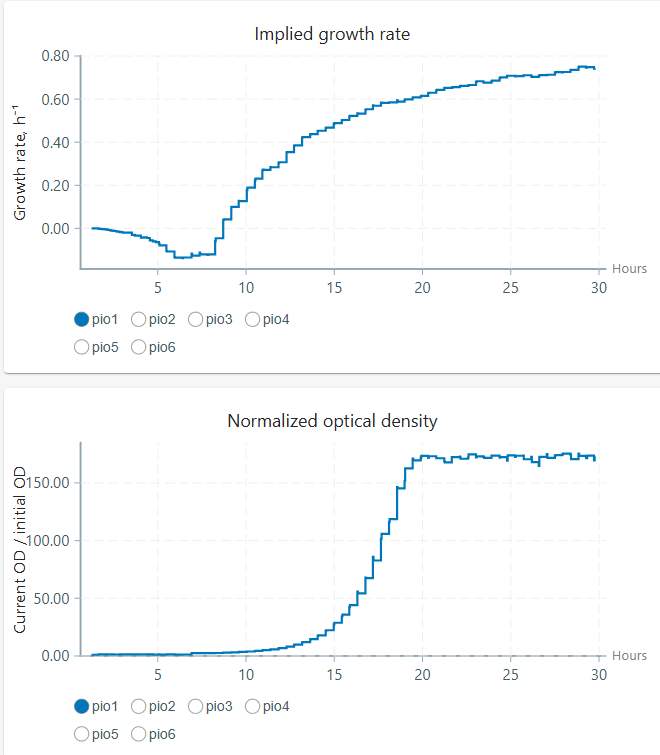
On a similar principle, in the next experiment, I grew yeast on regular YPD, and even when they got to the stationary phase, it seemed like there is still growth from the growth rate curve:
I have read about how the growth rate is being calculated, and still feel like I don’t fully understand how it represents the data and what influences it.
For the first chart, the growth in the stationary phase is very small. Back of the envelope math, and eyeballing numbers:
N_65 = 80
N_165 = 90
∆t = 100h
90 = 80 * exp(100 * r)
solving for r gives a very small number, ~ 0.001. So this would look like 0 on the graph.
The second one is more interesting, and I’m not sure. I think this is a Kalman filter parameter problem: we have an “acceleration” term, and I suspect that since your culture is growth very fast (150x in ~10h), the filter is putting too much emphasis on this accerlation term, and it’s getting carried away.
You can play with this parameter in the config.ini, under [growth_rate_kalman] look for acc_std and set it to a lower number (try half the value, or 0 even).
Unfortunately, there’s no way to “re-run” a growth-rate curve after the fact (even though all the data is available!) however it’s on our roadmap to handle this.