Hi!
I’ve been noticing over the past couple of weeks that the growth curves I’m getting for different strains are somewhat noisy.
In this case, there are both strains from direct inoculation and strains from co-inoculation. I was wondering what could be causing the lack of smoothness in the curves.
Any ideas?
Thanks!!!
Hi Curro, I agree this doesn’t look right.
Can you share your [growth_rate_kalman] section from the configuration? And, privately, can you share your (raw) od_readings export to me at cam@pioreactor.com?
Hi there!
Here the [growth_rate_kalman]
[growth_rate_kalman]
obs_std ↑ smooths growth rate, rate_std ↑ more responsive growth rate
acc_std=0.0008
obs_std=1.5
od_std=0.0025
rate_std=0.1
Thanks! 
Hi @curro99
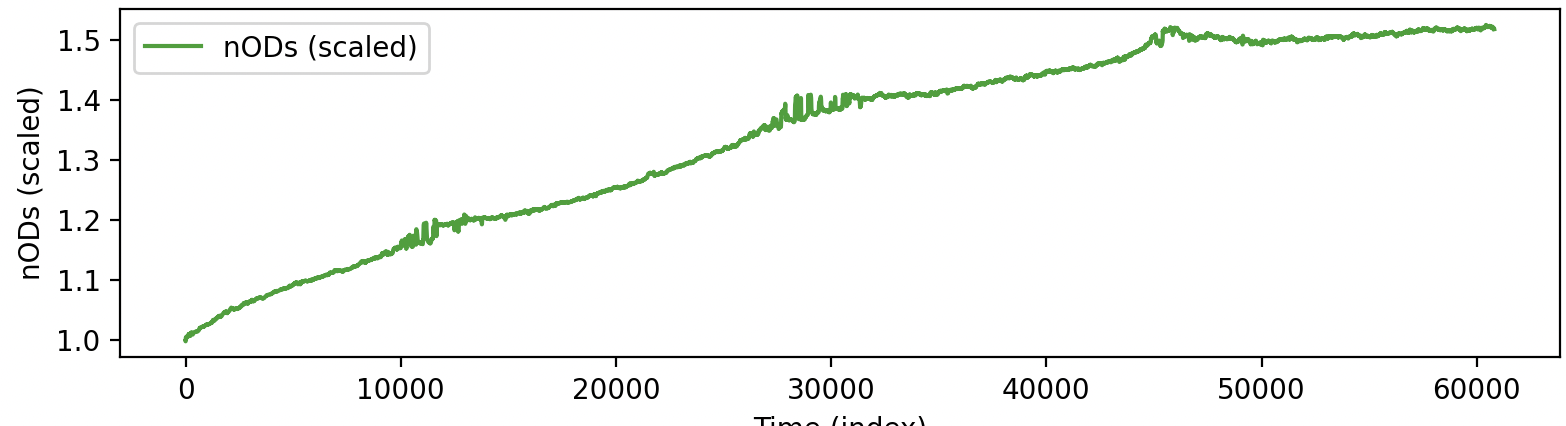
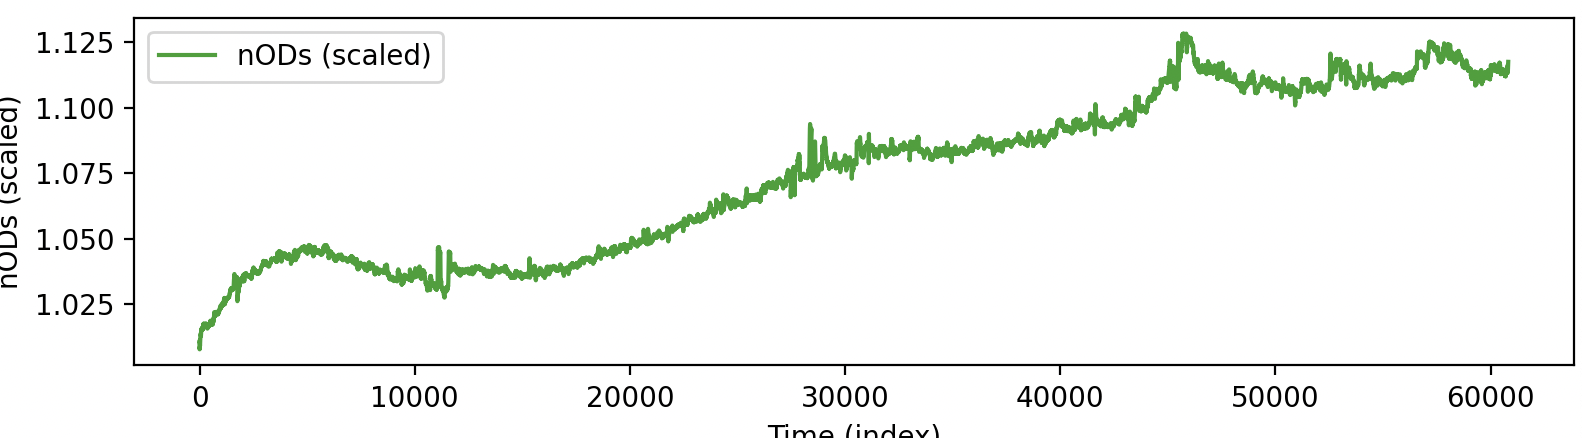
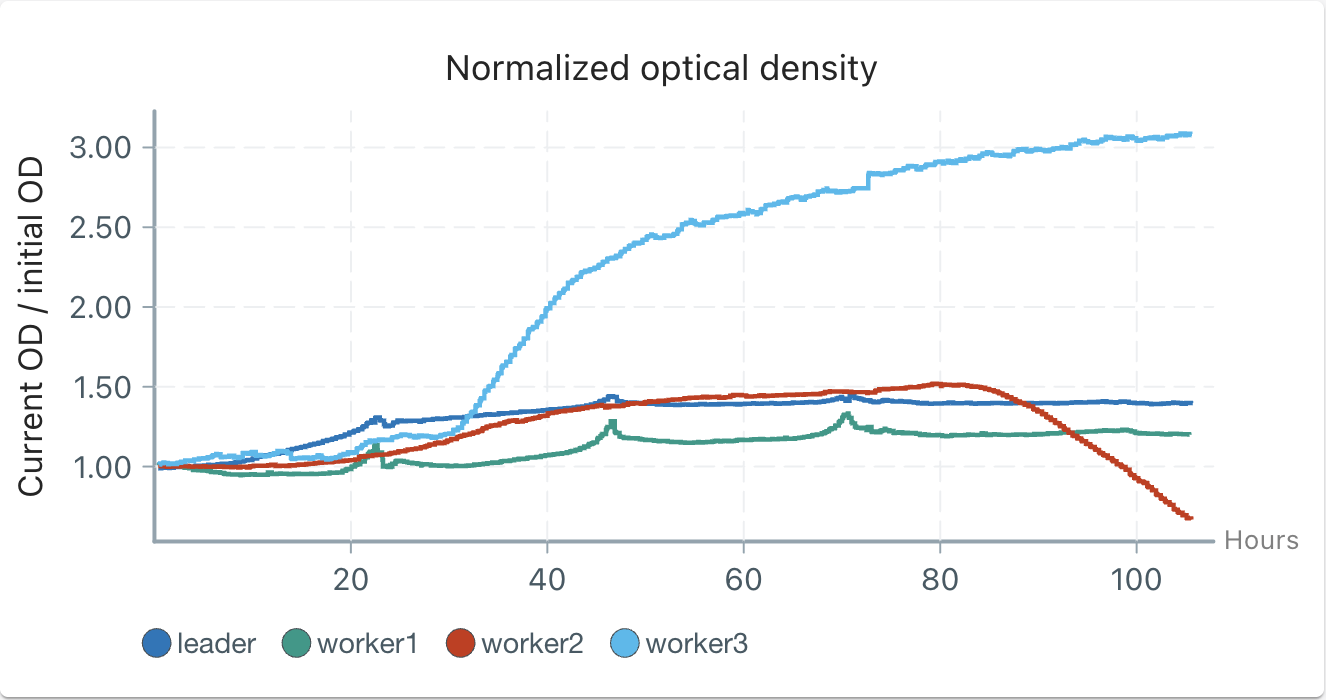
I’m still investigating, but I noticed that there are noise patterns in both leader and worker1 occurring at similar times:
Is there an large electrical device, or AC unit, nearby that might be causing noise in these two devices during runs?
Thanks, Cameron,
I just sent you a video of my setup. I do have it next to some AC units, and less than 50m away from 6 1000L tanks, that have sensors attached to them.
Bests!
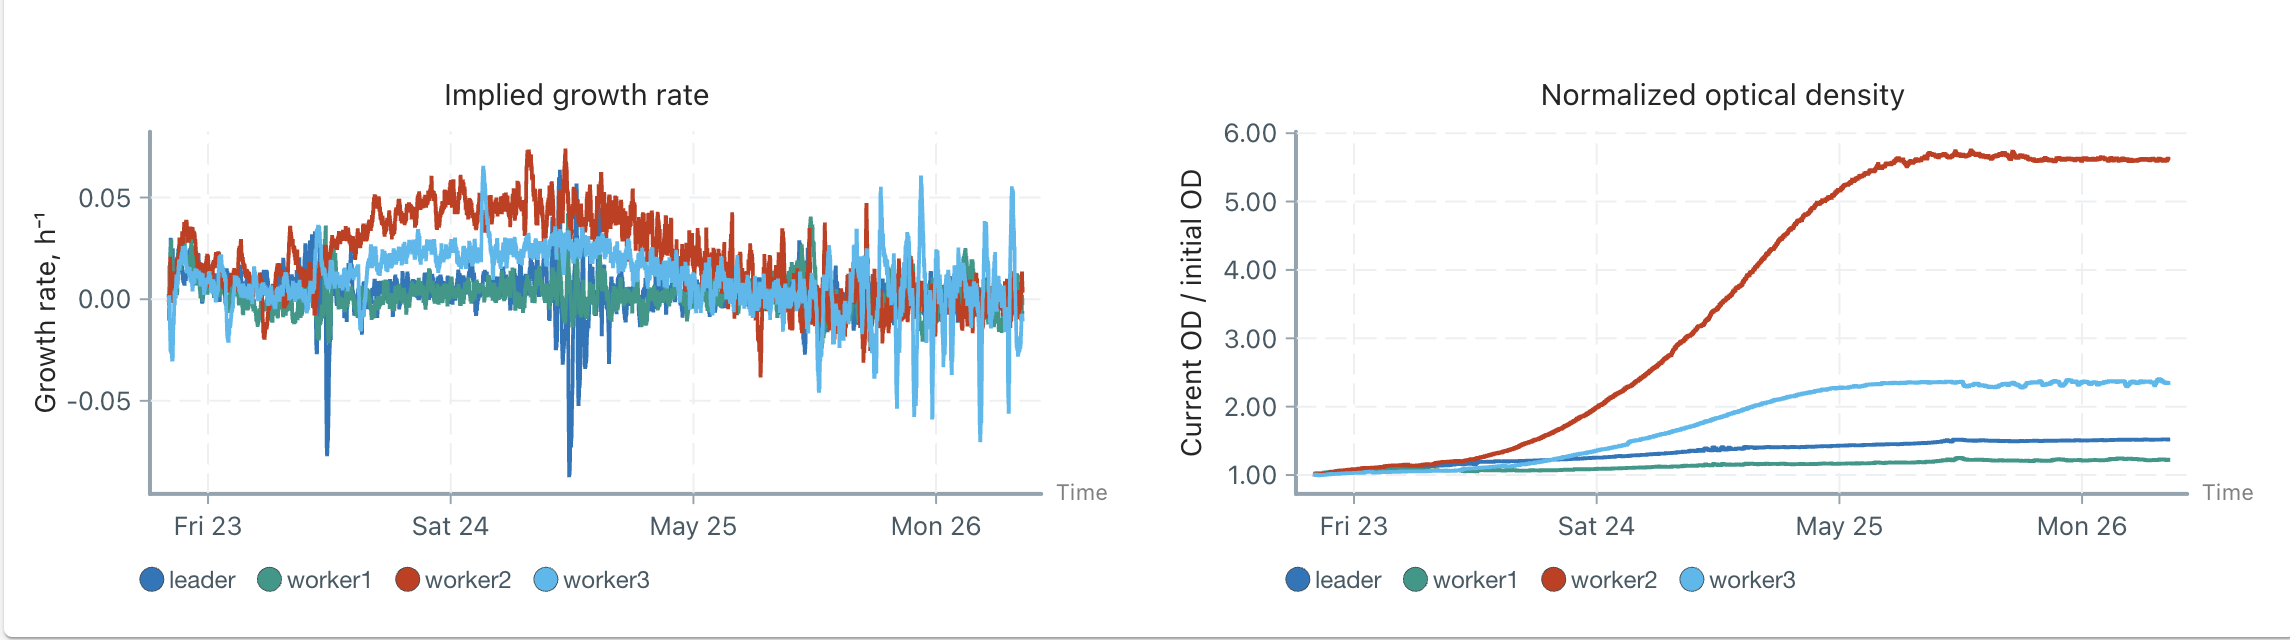
Circling back here: we made some improvements to the Kalman Filter (for the next release) that should fix some issues.
Previous: the observational noise was fixed at the start of the run, and scaled poorly. This isn’t true in practice, as we often see noise levels increase with the OD. I’ve added a dynamic obs. noise that measures noise better.
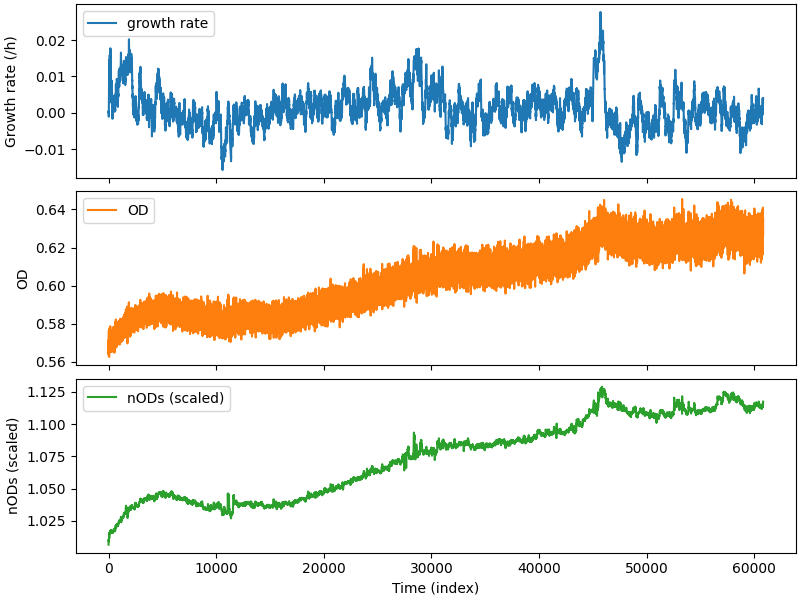
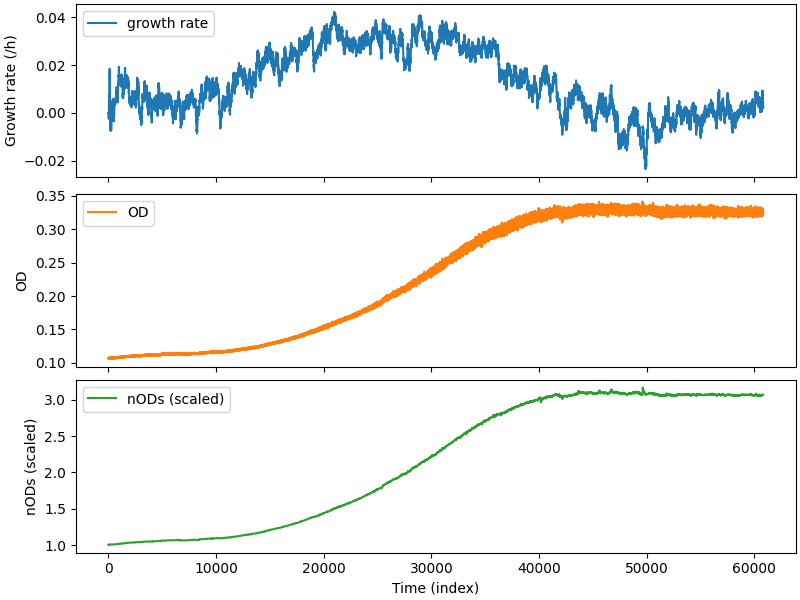
Here are your graphs with the updated code:
Don’t get too distracted by the “spikey-ness”, it’s be cause the scale is so small (<= 0.05 growth rate) - imagine these graphs zoomed out 10x which is a more common growth-rate.
We are working on a way to “replay” OD readings into our growth rate model so you can re-compute older experiments, too.
Thoughts?
This is amazing, Cameron—thank you so much! Just to make sure I fully understand: I’m guessing that noise is difficult to avoid, so it’s better to develop an algorithm to correct for it? The graphs make a lot more sense now 
I also have another question I occasionally wonder about—the evaporation factor. I usually run my experiments with a control vial that isn’t inoculated, and sometimes I notice a growth curve. At first, I thought it was contamination, but later I started to wonder if it was actually due to the concentration of solids in the liquid, giving the illusion of growth. This only seems to happen when I’m working under aerobic conditions (using 0.65 µm filters in each luer lock).
Bests!!!
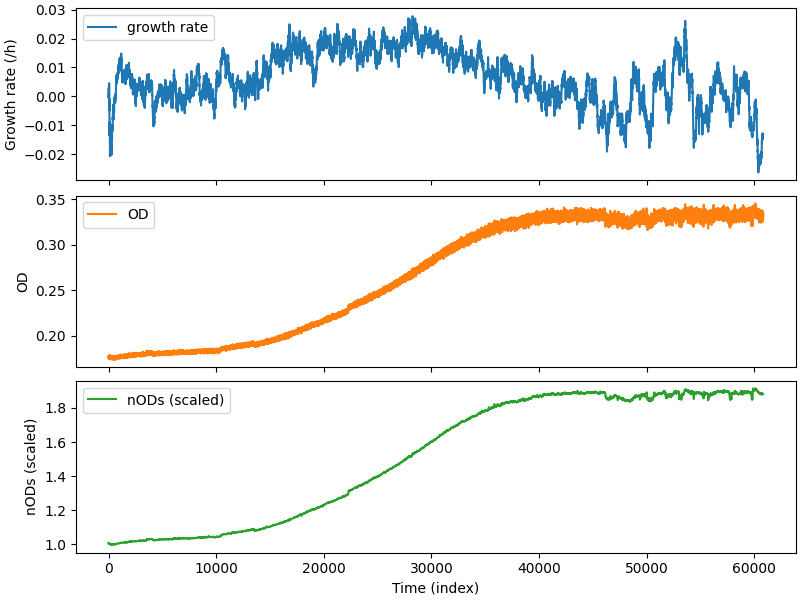
Can you share one of the outputs? (Is it the top-right graph in the previous experiment?)
Varying ambient temperature, or external lighting, can slightly changing the OD readings, and on a small scale, this can look like growth to our algorithm. Evaporation is another possibility.
Yes, ofc.
So here for example: Leader-ch2 should have no growing as it was control (no yeast added), I’ve found this pattern in an experiment today as well. ¿Then I guess that the peaks in the graphs could be related to Tª increase?
Thanks!
Those peaks might be related to the AC issue we discussed above, too.
Are you using the REF PD to normalize the IR LED, or is that doing something else?
I can check once I’m back in config. But I haven’t change any LEDs setup
I’ll do some research on how to minimize noise then! Thanks again Cameron