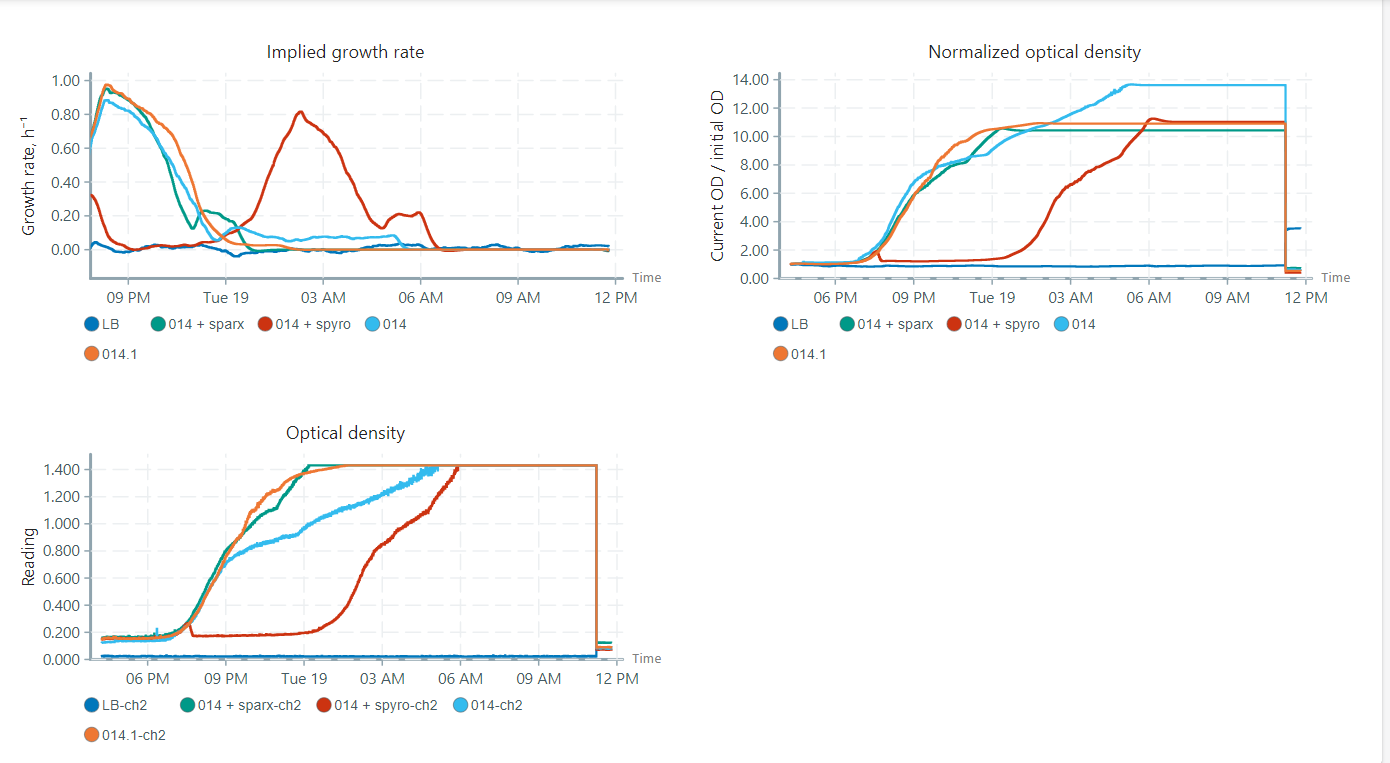
Hey everyone, we had a discussion yesterday about the Pioreactors data output concerning the OD readings and we were quite puzzled about something. Let me show you this data:
so here we see the bright blue sample which, when we look at the original OD readings, is not growing “faster” than the other samples, but when looking at the normalized OD readings it’s values are much higher. we tried to understand the logic behing normalizing these OD values and don’t quite understand the normalization calculations, so as we understood it is normalized by the initial OD (so the first measured OD?) by the current OD. we were thinking that it would be more helpful to be able to actually set this initial OD value instead of letting it calculate by the pioreactor. is there such a possibility? or another way of normalizing, so always normalizing it to 1 for example? because the way it is normalized now it is in my opinion wuite easy to misinterpret these graphs, what do you think? anyone did some thinking about this or encountered these problems?
Hi @LeoKleym
You’re correct that is a bit of an “artifact” caused by the normalization procedure.
so as we understood it is normalized by the initial OD (so the first measured OD?) by the current OD
Pretty much, that’s correct. Instead of the first measured OD, we take a sample of the first¹ 30 or so points and average them to get the denominator.
The light-blue culture starts with slightly lower OD, which makes its nOD’s denominator slightly lower, resulting in a higher nOD at the end (all else being equal). Is this incorrect? Maybe? Initially it might have really been a lower OD, and thus the nOD is correct. But it’s also likely that it’s just early noise and that noise gets magnified when used in the nOD!
we were thinking that it would be more helpful to be able to actually set this initial OD value instead of letting it calculate by the pioreactor. is there such a possibility? or another way of normalizing, so always normalizing it to 1 for example?
When you say normalize to 1.0, are you referring to the final data point or the initial data point? Like, do you want a OD graph that starts from 0 and goes to 1?
¹ “first 30 points” after growth-rate is turned on.
Thanks for your reply. i didn’t mean normnalizing it to 1 but starting at 0, i had a little knot in my head when writing this. so what do you think about normalizing by the way that the first 30 datapoints are set to 0 and the nOD is being calculated from there on? i don’t mean the actual OD measurements, they shoulod stay the same as they are, but i think there might be more potential with the nOD and normalizing it…? also, i am working with stuff thats killing by bacteria (on purpose haha) and i am getting this log from the reactors now, i blanked with uninoculated LB media, added my bacteria and my agent and now this is happening: should i be concerned or can i ignore this log?
greetings
leo
should i be concerned or can i ignore this log?
You can ignore it, but some data points might be missing from the resulting dataset. It happens when the current OD (raw) is less than the initial OD blank - which usually shouldn’t happen!
Yea it happened a few times already, i guess the LB Media is made from different people and can vary a tiny bit from person to person. i got another question: i only calibrated my OD until 1.4 because it is getting quite uncertain beyond this point but i usually let my experiments run longer and they do reach ODs higher then 1.4. Would you suggest to still calibrate above that because if it reaches the calibration threshold it changes the graphs the software gives me or is it fine since its all calibrated the same? here, look at this:
so in that image to me it seems like blue graph with MOI 1 is growing more/faster /whatsoever, but when looking at the OD its clear that its actually the one growing the latest in time. so for me its just kind of confusing the way the OD is normalized…
i only calibrated my OD until 1.4 because it is getting quite uncertain beyond this point
I don’t see why going past is a problem. It gets uncertain when you’re past the saturation point, and increased cell density decreases the signal we see. Up until that point, the calibration is well defined.
w.r.t. your comment about the blue curve. Yes that’s difficult to square. If you were to only look at the nOD, it would appear to be the most “productive”. But again, it could be an artifact of a low starting OD.
Hm, perhaps we should think about a most robust measure of the starting OD, since that’s probably what the root issue is here.
Hi to both,
Just to follow up on this one, we are also having a similar problem where the growth rate plots do not match with the nOD or OD plots for that matter. I think our issue is slightly different than the topic is created but similar to some extend in the way the plots are generated.
To be specific, in our case as illustrated below, the dark green and light green lines seemed to differ a lot in the between the growth rate and OD measurements.
Could this be an mis-coloration/interpretation issue by the software?
lets say i doesn’t necessarily gets uncertain but everything above exponential phase it not really what we are interested in. Actually, i just checked the starting OD from the birght blue lane, it was 0.025 and for example from the red line 0.028, whould that difference result in such an artifact?
Hi @sharknaro, this is a different issue, and probably just a UI race condition. Try to refresh the page - that may solve it. We’ll spend some time for the next release to make this more robust (currently it’s so-so).
1 Like
. Actually, i just checked the starting OD from the birght blue lane, it was 0.025 and for example from the red line 0.028, whould that difference result in such an artifact?
Maybe, but apriori I would have expected a larger difference between those two values.