Hi all,
I recently ran the OD calibration protocol on 5 of my Pioreactors and got some slightly concerning results and as such I have a few questions. My experiments use the microbe Corynebacterium glutamicum and I started at an OD600 of 4.12 (the highest I could achieve after a few days in large shake flasks with excess nutrients). This is higher than I reasonably expect to see in any experiment I would run (depriving them of an auxotrophic nutrient to induce overproduction), but I wanted a wide range to see how the calibration performed. I did 3 mL dilutions because of the wide range for which I was calibrating over (all the way down to 0.05, close to the medium blank OD600).
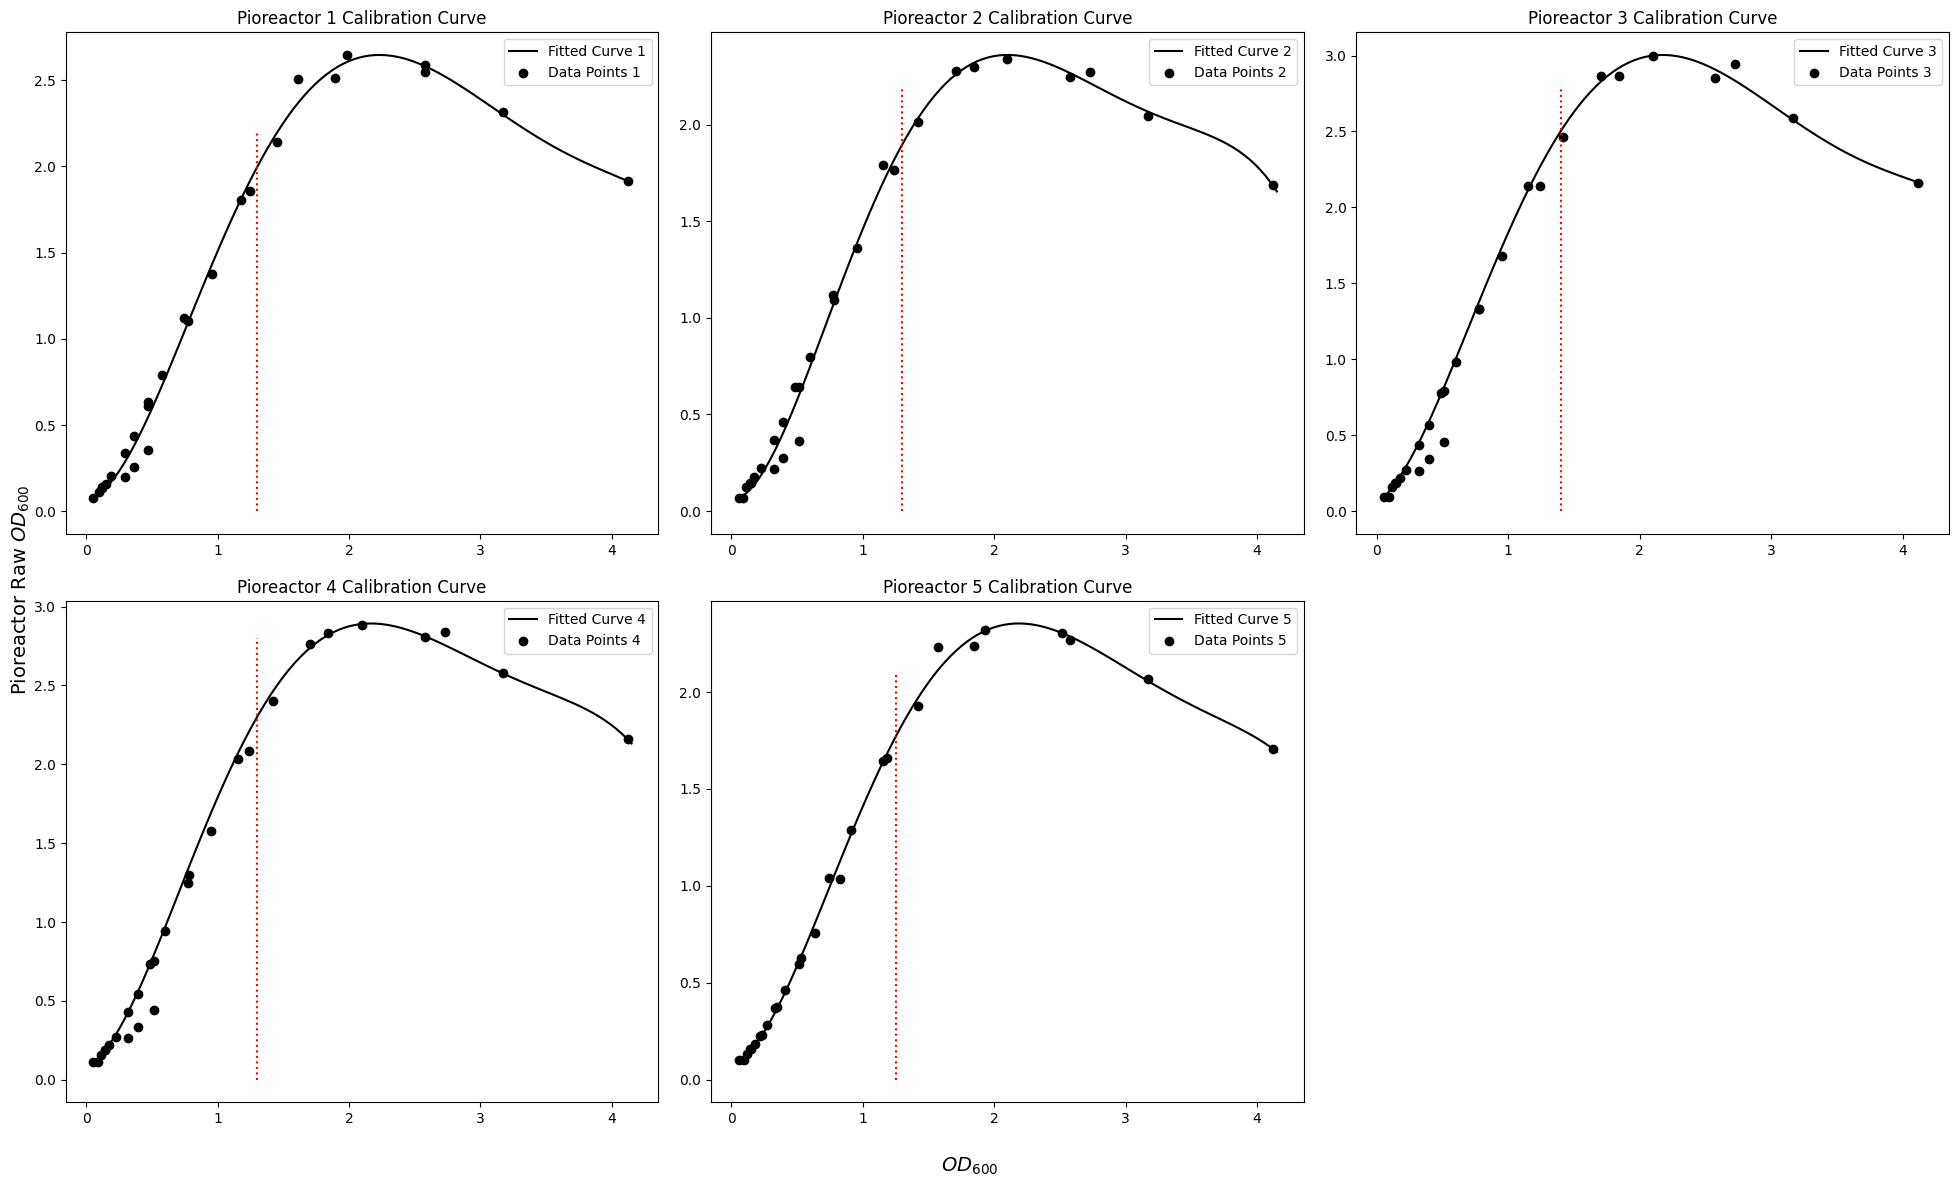
The 5th order curve I got back was somewhat parabolic in shape (see below) - I’m somewhat concerned that in the upper range the registered OD increased as the actual turbidity of the vial decreased. I assumed there would be a drop-off in the curve as it eventually went nonlinear, but this is beyond what I would have expected. Is this a limitation in the optics system? I’m working with v1.0 Pioreactors and had the side window open in order to better see the culture, so that may have impacted the calibration.
As well, the linear regime stops relatively early (~OD600 1.5 or lower). This is worrying as it seems that the Pioreactor reported OD is no longer a good analog for concentration at relatively easily growth stages. I’ve attached below the raw output from the calibration curve of one of the Pioreactor calibration protocol runs and a plot showing the points and fitted curve of all five calibrations I did with the same settings in different Pioreactors (this is not isolated to one Pioreactor; red line representing roughly where it leaves the linear regime). Any suggestions or help would be greatly appreciated.
  OD Calibration with curve of best fit
    ┌─────────────────────────────────────────────────────────────────────────────────┐
2.99┤                                   ▖▄▞▄▄▄▄▄▄▄▄▄▄▄▄▖                              │
    │                              ▝ ▄▟▀▀              ▝▀▚▄▄                          │
    │                              ▟▀▘                      ▀▀▄▄▖                     │
    │                           ▄▞▀                             ▝▀▀▄▄▄                │
2.41┤                         ▗▞                                      ▀▀▀▄▄▄▖         │
    │                       ▄▞▘                                             ▝▀▀▚▄▄▖   │
    │                     ▗▞▘                                                     ▝▀▀▀│
    │                    ▄▘                                                           │
1.83┤                  ▗▞                                                             │
    │                 ▞▘                                                              │
    │               ▗▞                                                                │
    │             ▗▄▘                                                                 │
1.25┤             ▞▘                                                                  │
    │           ▗▞                                                                    │
    │          ▄▘                                                                     │
    │        ▖▞                                                                       │
0.67┤       ▗▛                                                                        │
    │      ▞▘                                                                         │
    │    ▖▛                                                                           │
    │  ▗▟▀                                                                            │
0.09┤▄▀▘                                                                              │
    └┬───────────────┬───────────────┬───────────────┬───────────────┬───────────────┬┘
   0.05            0.87            1.68            2.49            3.31           4.12
OD Reading (Raw)                           OD600
Calibration curve: -0.029x^5 + 0.382x^4 + -1.692x^3 + 2.530x^2 + 0.590x^1 + 0.053
{
  "type": "od_90",
  "created_at": "2024-06-20T21:27:08.317466Z",
  "pioreactor_unit": "worker3",
  "name": "C_glut_w3_od_cal_2024_06_20",
  "angle": "90",
  "maximum_od600": 4.12,
  "minimum_od600": 0.054,
  "minimum_voltage": 0.0922209356778132,
  "maximum_voltage": 2.99442298355432,
  "curve_type": "poly",
  "curve_data_": [
    -0.0293904694742067,
    0.3816248032310022,
    -1.691954110080892,
    2.5295110686008617,
    0.590213778155456,
    0.05305620728226137
  ],
  "voltages": [
    2.1629156632140085,
    2.5873504932769062,
    2.855426397850491,
    2.9434328381471406,
    2.99442298355432,
    2.864492595522516,
    2.867258356191147,
    2.4653339845134656,
    2.139300295628422,
    2.139820026688538,
    1.681960152342427,
    1.3304407805527672,
    1.3314293462026523,
    0.9794306326462092,
    0.7740079383786571,
    0.7912412691383082,
    0.5682179369822,
    0.4347582629094729,
    0.45229256300048337,
    0.34033148922553025,
    0.26520854172776537,
    0.2714836430477133,
    0.21929826118760756,
    0.18544167371210757,
    0.18685906228952753,
    0.15795660625785163,
    0.09282725291525584,
    0.0922209356778132
  ],
  "od600s": [
    4.12,
    3.1692307692307695,
    2.575,
    2.544,
    1.956923076923077,
    1.59,
    1.832,
    1.4092307692307693,
    1.145,
    1.224,
    0.9415384615384615,
    0.765,
    0.74,
    0.5692307692307692,
    0.46249999999999997,
    0.507,
    0.39,
    0.316875,
    0.329,
    0.2530769230769231,
    0.205625,
    0.229,
    0.17615384615384616,
    0.143125,
    0.145,
    0.11153846153846153,
    0.090625,
    0.054
  ],
  "ir_led_intensity": 50.0,
  "pd_channel": "2"
}