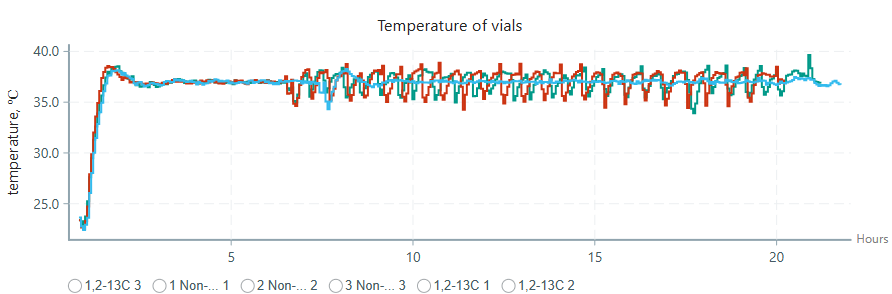
Ticking-out the pioreactors did not remove the lines on the plots. These lines correspond to the middle 3 pioreactors. Has anyone experienced similar issues?
Hm, I’m not able to reproduce this. I thought it might be the aliases, but that seems fine. Checking deeper now
I think you are onto something already (aliases). The ones that failed to disappear had the name # Non-... and checking logs I can see these names were as # Non-labeled #. It could be that the aliases were too long? Can I provide any log output to confirm if it is indeed aliases?
Did you or a team member choose the alias # Non-labeled #?
Oh yea, alias # Non-labeled # does fail to hide the lines…
@sharknaro the error is simpler than that: it’s a bug in the chart & alias connection. If the alias is > 12 characters, the plot lines won’t disappear. Fix in the next release. Sorry!
1 Like
Yes, a team member decided to use this alias for his experiement and then we discovered the situation.
This is fixed in 26.4.x